
These days, we’re suffering from an acute case of information overload.
When it comes to construction projects, you might have access to a lot of data, but can you make sense of it?
How confident are you that you can answer these questions, right now?
- Is my project on track to be fully coordinated, on schedule?
- Who is responsible for holding up progress?
- Which parts of the project are at risk for delays?
If you’re stumped for answers, make sure you keep reading to find out how to leverage your project data for actionable insights!
What are the benefits of Business Intelligence for the construction industry?
It’s no secret that construction projects generate mountains of data, especially in a digital BIM environment. Business Intelligence tools make it possible to mine all this data to easily spot trends, measure performance, and highlight problem areas.
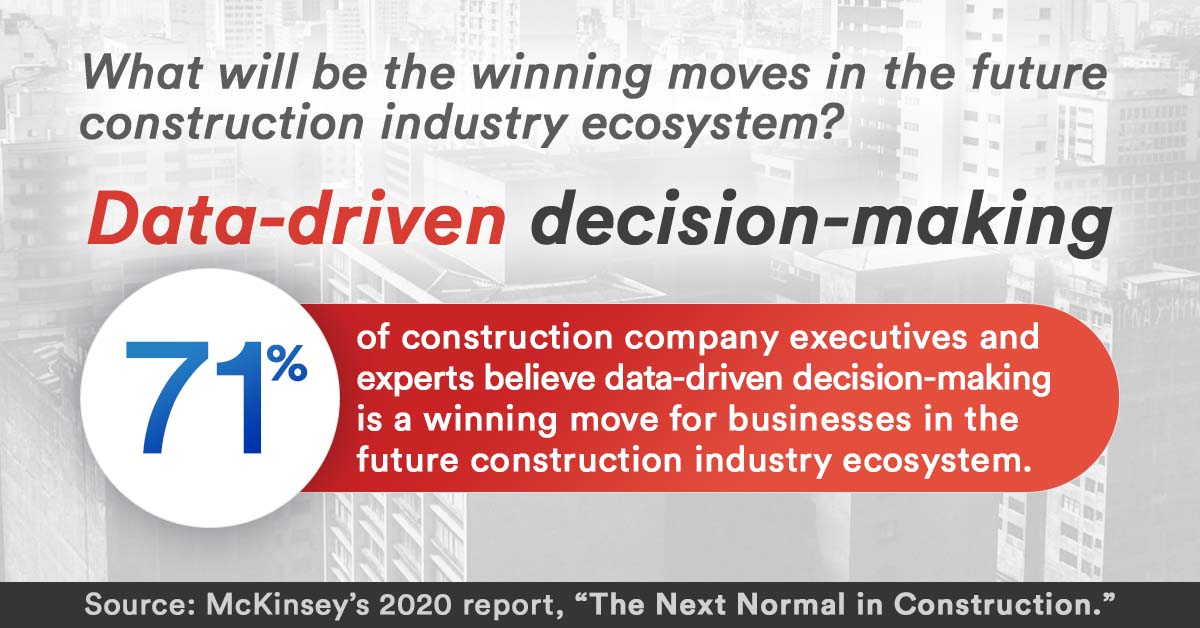
McKinsey's 2020 report, The Next Normal in Construction, highlights data-driven decision- making as a significant driving force for change in the construction industry. In a survey of 400 construction industry executive and expert interviews, 71% of respondents rated prioritizing digital skills and making data-driven decisions as a winning move for businesses in the future construction industry ecosystem.
Here’s how the construction industry’s leading contractors are benefiting from business intelligence:
Gain a competitive edge
Technology and design-construction best practices are evolving rapidly in the construction industry. To stay ahead of the pack, you need to be continuously improving. But without data, it’s often hard to know what to improve. Business intelligence helps you gain insights into your business’s strengths, and highlight what you need to work on to maintain your competitive edge. You can also prove your success with objective performance data and reassure owners that your firm is the best choice.
Manage risk
Life, and construction projects, are full of risks. The good news is that they can be managed. Displaying project data in a business intelligence platform can help you monitor your project health with live data and easy-to-read visuals, allowing you to pinpoint project schedules at risk, isolate and segment specific teams, zones, or disciplines to uncover specific actionable items. Armed with these insights, you can be proactive in addressing problem areas before they impact the project schedule and bring your risk levels down.
More accurate forecasting
Business intelligence comes into its own when you’re compiling data from multiple projects. With this data, you can benchmark your team and plan future projects with greater accuracy. You should also gain greater control over costs, since you can estimate more accurately how long a particular type of project will take to complete, or which areas are likely to cause additional costs.
3 Must-See BIM Coordination Dashboards
We figure it’s better to show, not just tell. Here are some of our favorite BIM coordination dashboards from clients leading the pack when it comes to BI.
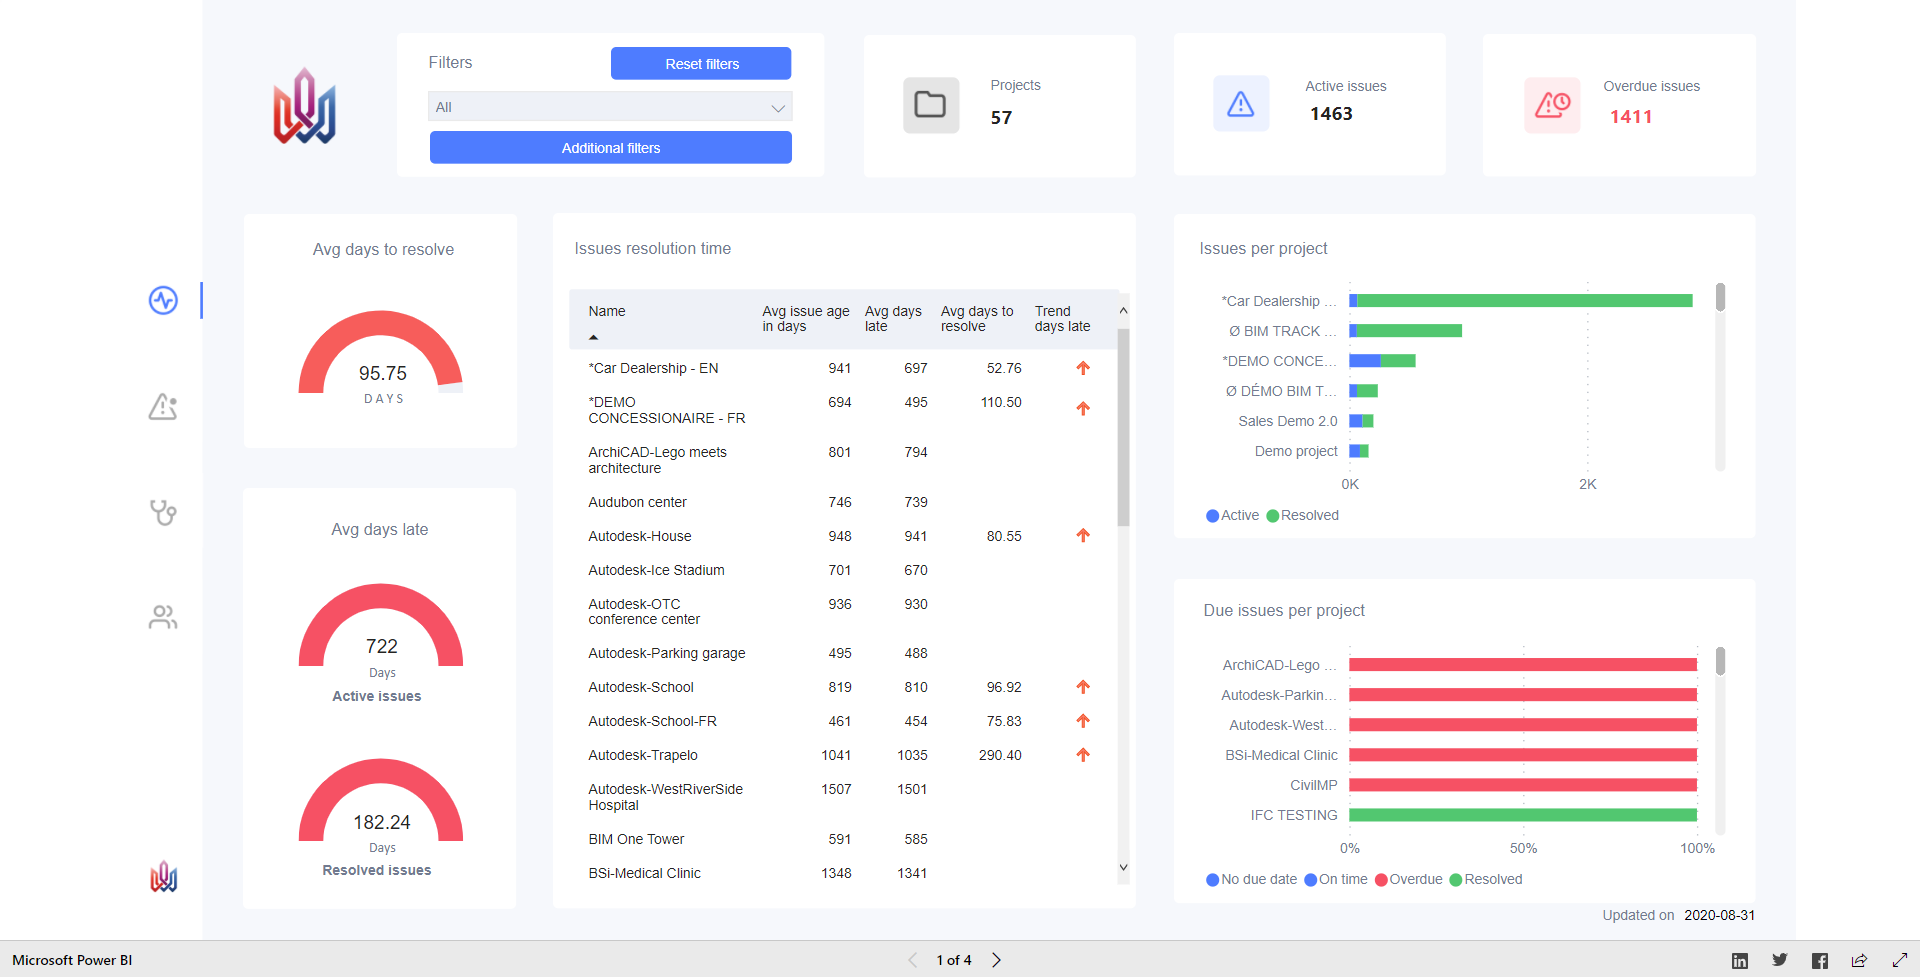
DPR Construction VDC Dashboard - BIM Track, Smartsheet, Power BI

Check out this BIM Coordination Masterclass with David Stone for an in-depth look at DPR Construction’s model-based coordination dashboards.
This dashboard draws coordination data from BIM Track, as well as schedule information from Smartsheet, into Power BI for a comprehensive overview of coordination progress.
WSP Dashboard for Hanover Square - BIM Track, Power BI, VCAD

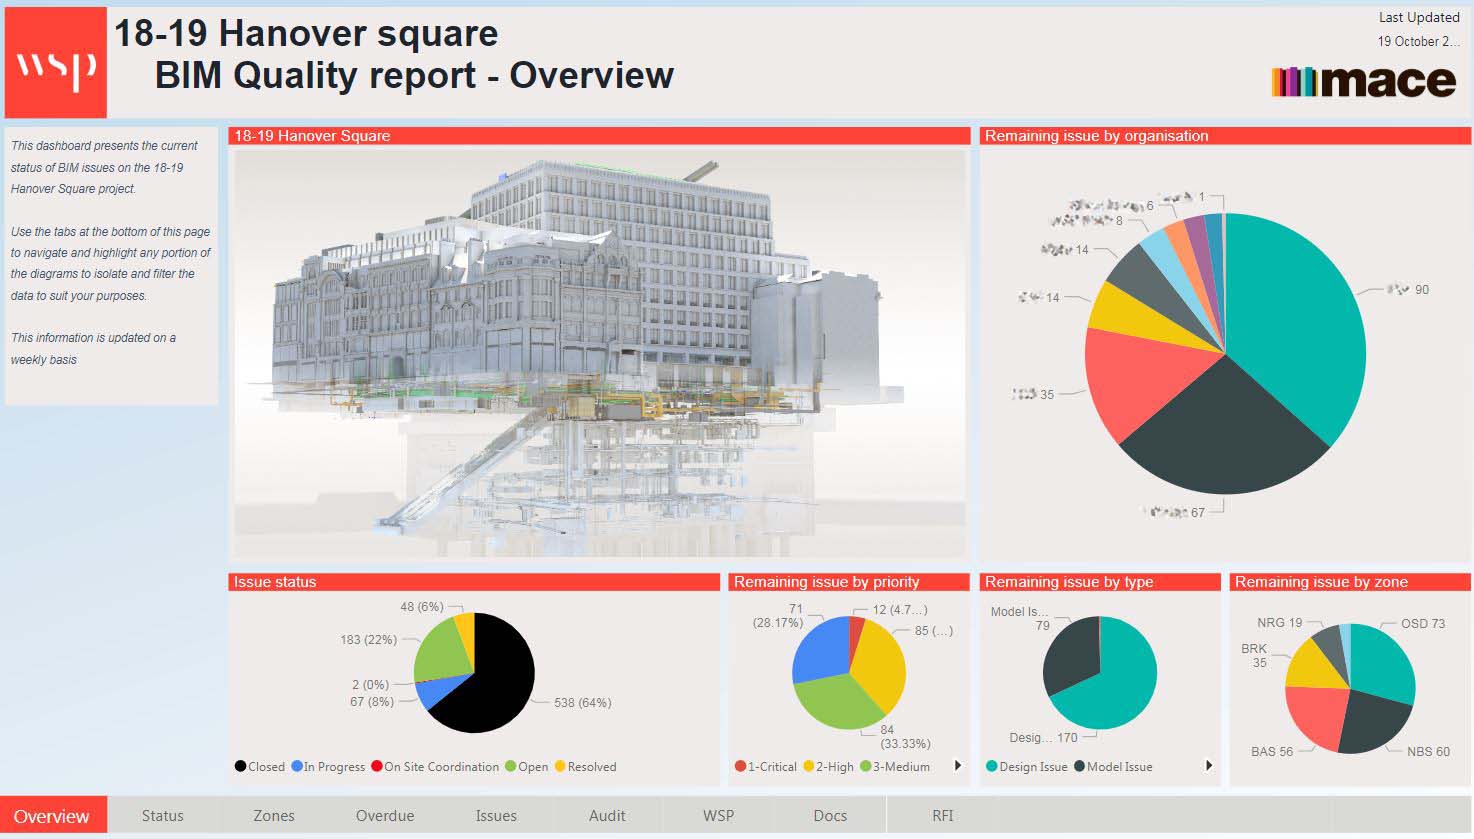
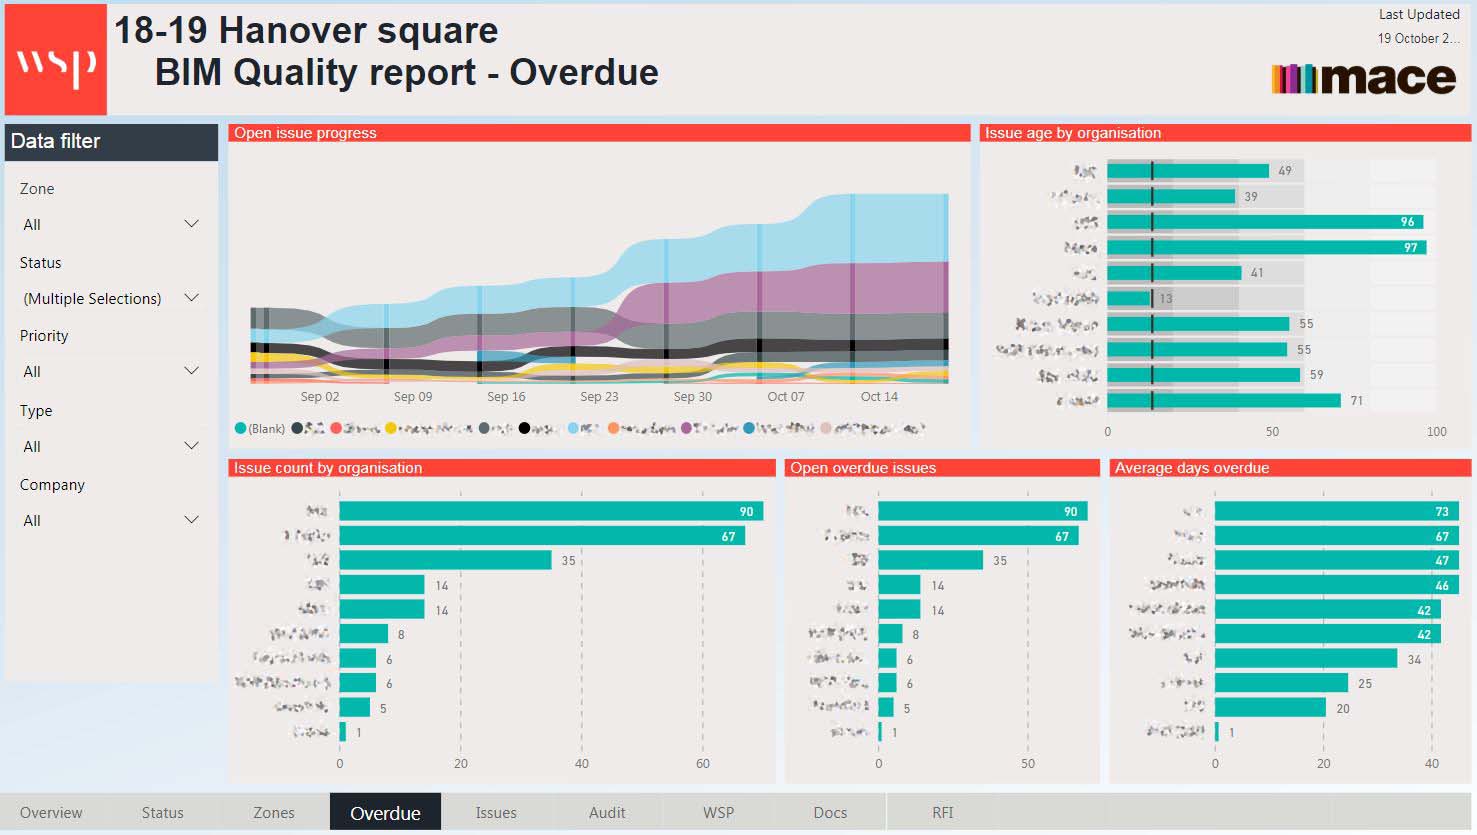
This dashboard was set up by WSP in the UK and Mace to provide live insights on the incredibly complex Hanover Square project in the heart of London. It pulls issue metadata from BIM Track, along with some great visuals of the BIM, issue map, and open issue progress.
While in this case, the dashboard features images of the project, WSP has also used Vcad custom visual for Power BI to link the IFC model into the dashboard. Pretty cool!
Egis Dashboard - BIM Track, Power BI, Revit, Autodesk Forge

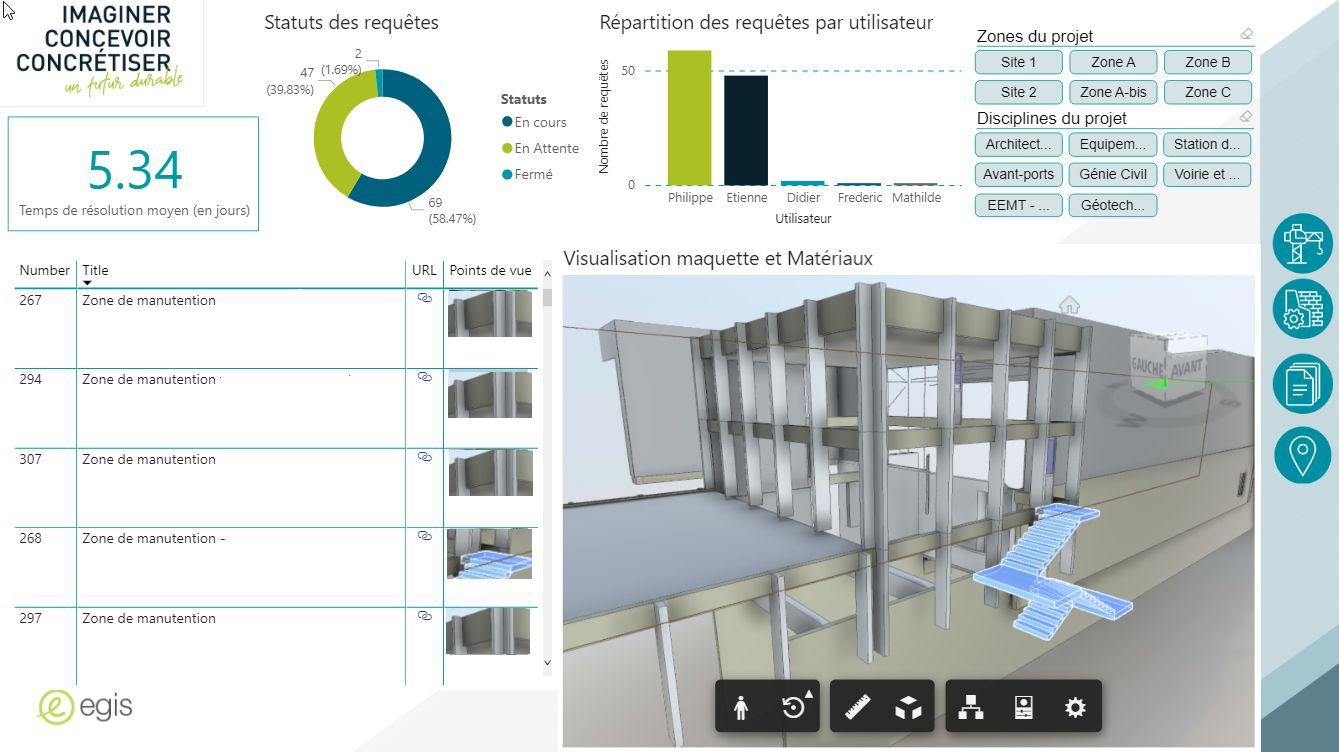
Shoutout to Arnold Ledan for sharing a snapshot of this dashboard on LinkedIn!
This dashboard created in Power BI draws BCF data from BIM Track, but also integrates the digital model of the project designed in Revit via Autodesk Forge.
Egis has found this dashboard useful in several cases, including project reviews, since data can be centralized, connected, and visualized regardless of the source - planning, software, models, compliance sheets, BCF, financial monitoring, and other indicators.
How to get started with Power BI dashboards
Hopefully, by now, you’re sold on the benefits of business intelligence for construction projects, but the question still remains: how do you get started?
Setting up your own Power BI dashboard can be a little daunting, and you might run into some problems such as:
- The raw data is not formatted for reporting and requires cleaning before it’s dashboard-ready
- You have to keep on top of manually publishing data regularly, or you won’t have an accurate picture of what’s going on
- Deciding which KPIs and indicators to track can be overwhelming when faced with so many possibilities
After receiving many requests from our clients for support with Power BI, we are excited to share our brand new Data Analytics Service with you!
With this solution, we hope to empower our clients with advanced coordination analytics without the hassle.
Here’s a summary of what’s included:
- Dedicated data hosting infrastructure in your region, ready to connect to analytics platforms like Microsoft Power BI
- Fully automated updates, so there’s no need for you to waste time exporting & importing data
- A ready-to-use Power BI dashboard with metrics tailored to construction projects, as well as further customization and KPI coaching from our BIM and BI experts
You can also explore our Power BI template for construction projects which is included in our service here:
Thanks for reading!
We hope this blog was helpful for you in navigating the world of data analytics for construction projects. If you have any questions, or perhaps if you have a dashboard of your own you’d like to share, you can reach out to us at sales@bimtrack.co.