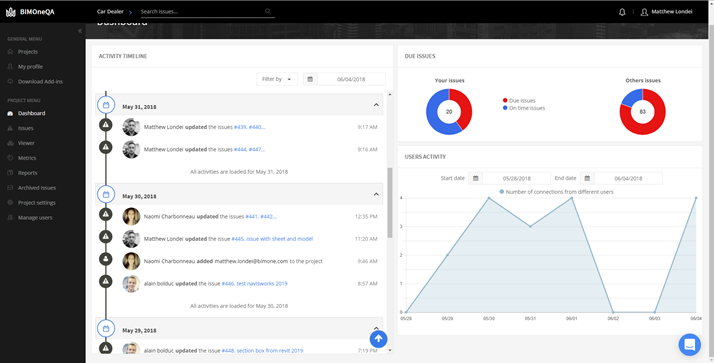
With last night’s release, we have introduced a major new feature to make BIM Track task management even easier for individual users: project dashboard. Project dashboard gives you a project-specific look at what affects your issues as an individual user. It will be the first thing you check when you log in, with an activity timeline that shows all activities that are relevant to you. It also includes metrics to quickly see how many of your issues are past due and much more. Check out our short video below, scroll down to learn more or visit your web platform, click “Dashboard” from your Project menu on the left-hand side, and start exploring.
Explore BIM Track’s Project Dashboard for a tailored, user-specific experience.
Activity timeline
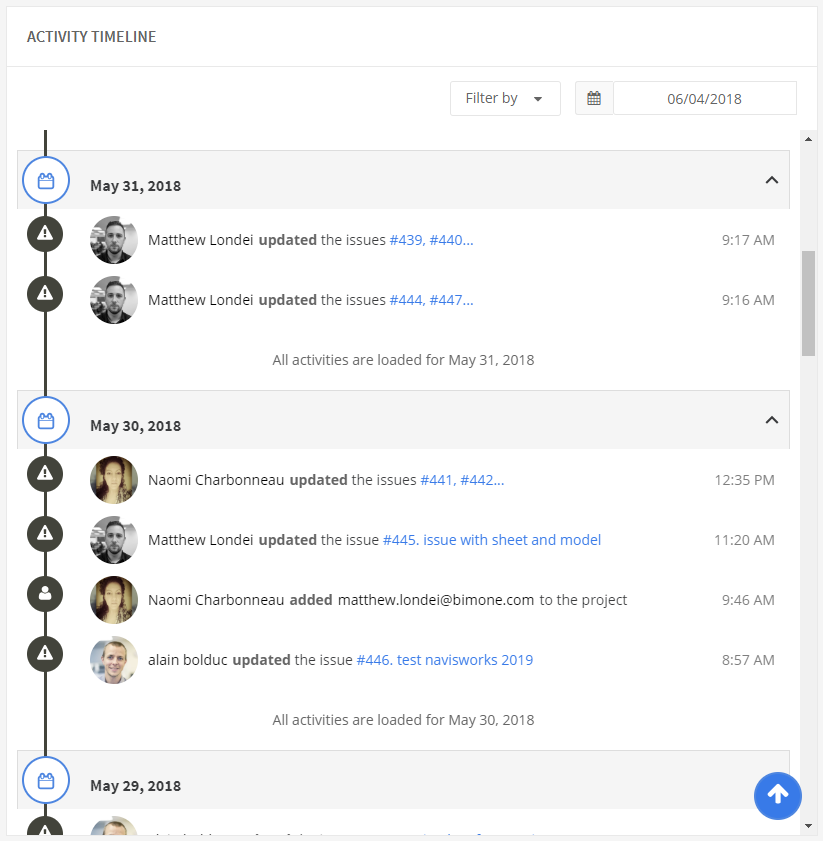
Activity timeline is a user-specific “newsfeed” of various project activities that includes:

- New issues raised with you assigned or notified.
- Any updates to your assigned or notified issues, with issue numbers hyperlinked to those specific issues in BIM Track’s web platform. Multiple issue updates at the same time will be listed as one entry with the issue numbers, whereas one issue update will show the issue number and title.
- New models uploaded.
- New PDFs added (BETA).
- All users added to the project.
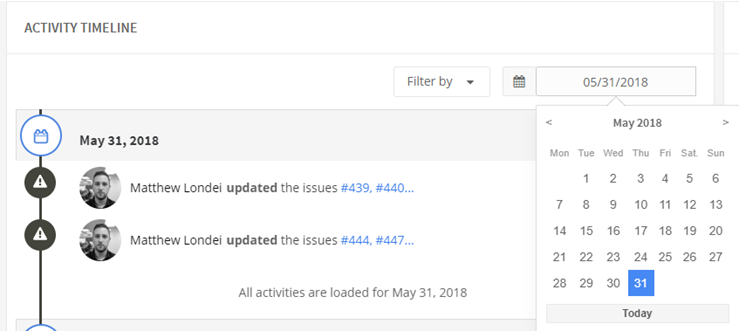
The activity timeline is also more than a normal newsfeed, because you can tailor what you see. You can also use the filtering and calendar options at the top to quickly find what happened at any given moment in your issues. You can also collapse days or “show more” to see further back in time.

Figure 2.0 Filtering options for the user-specific activity timeline in BIM Track, including sorting by date and filtering by activity type.
Due issues
Two donut charts at the top right show how on track you are with your issues. These are called Your issues and Others issues. Your issues, on the left, indicates which of your issues are overdue and which are on time. You can drill down to those issues as well by clicking on the section you would like to investigate further. On the right, we see the project's other issues, which shows what issues are overdue and what are on time on the entire project.

Figure 3.0 Due issues per user and by others in BIM Track’s project dashboard.
Users activity
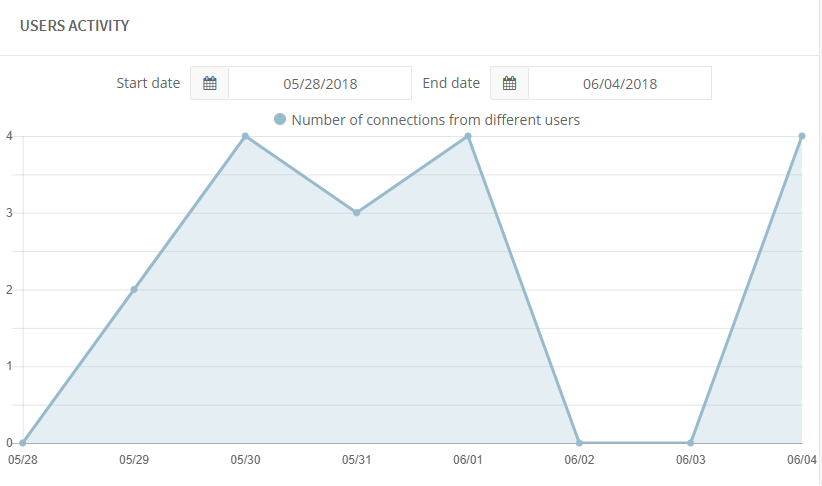
Users activity monitors who from the team has logged in to BIM Track each day. If there is a significant milestone coming up, it is important to make sure team members are working to update and resolve their issues. Users activity automatically shows the last 30 days, but this is customizable.

Figure 4.0 The users activity chart shows how many people have logged in daily on the project.
For more information on using these new features, please consult our help center article.

